Showing posts with label portfolio. Show all posts

Friday, 29 September 2017

2017 9M performance

Performance
Another quarter has passed and it's time to take stock of portfolio's performance.

It is a muted performance for the quarter, resulting in a slight increase in NAV compared to 20171H performance. In fact, if not for the strong performance of Valuetronics and UMS over the past few days, this quarter will post a return lower than 20171H.

NAV of portfolio grew from $3.78 (30 Dec 2016) to $5.22 (30 Sep 2017), providing a return of 37.8% for 9 months. Definitely happy as this is well above my stretched target of 12% and also beats benchmark STI ETF which returned about 14% (inclusive of dividend) over the same period. 

The chart below shows the performance of  past 7 quarters.


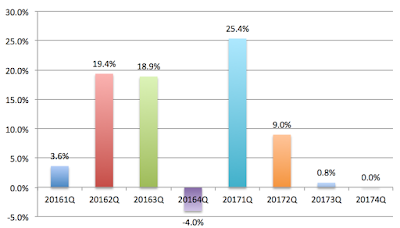
The muted quarter's performance can be attributed to the following:
  • weaker market sentiment for the past quarter, 
  • continued sell-down of Raffles Medical Group, 
  • correction of Food Empire,
  • divestment of  Micro-Mechanics which shot up 20% after I sold, *ouch*
  • increase in trading activities as I look for new ideas for the next few years.
Gainers and losers
The following tables show the top gainers and losers for this year thus far. The list should remain pretty much the same by end of the year.

I am glad that 7 out of my 10 core holdings have returned more than 10% thus far this year. Even with the divestment of Best World and Micro-Mechanics, the ratio of 5 out of 8 still looks good.

Looking at the table, it seems that I have a tendency to divest my non-core holding once it has done well. This is something which I wasn't aware of before this post. It will be something that I will take note of in future. Instead of divesting the counter after a strong performance, another option would be for me to spend more effort in understanding the counter and determine the possibility of turing it that into a core holding.

Punting on counters based on minimal information and uncertain business outlook continues to be a game of chance. Fu Yu went 10% up but Oceanus and Innotek went the other way. Not in a hurry to divest Oceanus and Innotek yet as amount put in was minimal, especially for Oceanus. Also, am still feeling positive of a possible turnaround next year or the year after next.

The table also highlighted the strong performance of my three counters in my CPF portfolio which returned 16% thus far. If this continues for the rest of the year, it will be the 9th consecutive year that my CPF portfolio beats STI ETF.

Allocation
Dividend vs Growth
With the divestment of two core holdings and exploration of the US market, the allocation looked quite different from the the first half of the year. Cash stands at a high of 15%. Dividend yield of portfolio based on cost is at a low of 3.4%. 


Planned
Actual
Dividend
~ 60%
55%
REIT/ Business Trust
<= 30%
25%
Growth
~ 40%
30%
Punt
<=10%
3%
Cash
0%
15%

Singapore vs US
Being new to US market, I decided to allocated at most 15% of my fund to it till end of 2018. Currently, it stands at about 12% with 4% invested and 8% in cash.

Action
For the month of September, I have sold
  • Dairy Farm at US$8.03 for a gain of 5.0%.
  • Singapore O&G at $0.49 for a gain of 2.1%.
  • mm2 Asia at $0.49 for a gain of 1.9%.
  • Mapletree GCC Trust at $1.15 for a gain of 4.9%.
I have bought the first 3 in August due to their steep drop. Decided to divest them for a quick profit and re-invest them in other counters which I am more familiar with. As for Mapletree GCC, bought it last month with an incorrect understanding of the location of its HK property. Got lucky with it, so decided to take profit.

On the US Market, I have also sold 
  • Cognex at US$114.45 for a gain of 3.4%.
  • Mastercard at US$140.23 for a gain of 6.1%.
  • Priceline at US$1840.60 resulting in a loss of 5.1%.
  • Chipotle at US$307 resulting in a loss of 13.4%. 
Dug into the numbers and checked the PE and growth rate of my US counters. The current PE for the first 3 stocks are all much higher than its historical average and PEG are all above 2. Hence, decided to divest them. As for Chiptole, there is currently too much uncertainty and so decided to stay away from it for the moment.

I have added
  • more Straco at $0.87. Continue to like its cash generating business. This article by the "Rock" in NextInsight provides a good reading.
  • more Hong Kong Land at US$7.28. Same reason as initial purchase in August. Cheap P/B and good results.
  • more 800 Super at $1.085 as it continued to trend lower after its announcement of its Q4 results. Two quarters of weaker performances but it has continued to increase its dividend. Looking for a better performance in 2018.
  • more Japan Food at $0.435. Same reason as initial purchase - consistent dividend.
  • iFAST at $0.87. Its price has slid from its high after announcing a strong 1H results. While its China business will take some time to break even, its other countries performance is growing very well.
  • Hock Lian Seng at $0.445. High visibility due to strong record book. If the company is able to maintain its dividend of 2.5 cents, then the yield is about 5.6%.
  • ComfortDelgro at $1.995. Bought a tiny stake as I felt that it is oversold. While Taxi business is under great pressure, rail and bus are still doing well. Due to a sudden turn in its share price, I sold it today at $2.08 for a small gain of 2.8%. 
You can click on July and Aug for my actions taken in those two months.

Core holdings
Core holdings are counters which I am more familiar with. These are counters which I am more confident of and have a more substantial holding (at least 5% of portfolio); hence I am more likely to hold them for a longer period of time.

The current average holding period is about 2.4 years, as compared to 0.5 years for the remaining holding.

Divestment of Best World and Micro-Mechanics and purchase of VICOM has resulted in partial change of core holdings. These 8 (out of 26) holdings make up 53% of my outlay cost.
  1. Food Empire (9%) @ $0.46
  2. Raffles Medical (8%) @ $1.41
  3. Straco (8%) @ $0.85
  4. Parkwaylife REIT (6%) @ $2.32
  5. Valuetronics (6%) @ $0.54
  6. Fraser Centrepoint Trust (6%) @ $2.03
  7. VICOM (5%) @ $5.75
  8. Starhill Global (5%) @ $0.70
Looking Ahead
For the remaining quarter, I am looking forward to dividend from various REITs, 800 Super, RMG, SingTel, UMS, iFast and Japan Food. 

I am also hopeful of good quarterly result from Food Empire, Straco and Valuetronics which might have a positive impact on their prices. Raffles Medical Group should report another quarter of muted performance.

Barring any unforeseen circumstances, return for the year should be above 35%. With some luck, it might breach the 40% mark.

Saturday, 1 July 2017

2017 1H Performance

Half a year has passed and it's time to report on portfolio performance again. Happy to report a good half yearly performance with a good second quarter riding on an exceptional first quarter.

Performance
NAV of portfolio grew from $3.78 (30 Dec 2016) to $5.17 (30 Jun 2017), providing a return of 36.6% for 6 months. This is above my stretched target of 12% and also beats my benchmark STI ETF which returned 14.6% inclusive of dividend over the same period. The charts below show the past 6 quarters and past 3 half-yearly performances. The drop in prices of a few counters in the past few weeks have weakened Q2 results but nonetheless a 9.0% return is a good one which I will take for any other year. The exception Q1 performance has also led to the best half yearly performance.


The strong performance is attributed to a combination of positive sentiment in the local market and good results reported from my top ten counters over the past two quarters. A summary of my top ten counters' last quarter performance can be found here.

The top performers continues to be Best World. After stock split and dividend, it has returned 127% this year. This is supported by core stock such as Valuetronics (47%), Food Empire (35%), Micro-Mechanics (32%), Straco (19%), Parkway Life Reit (15%), and Frasers Centrepoint Trust (14%).

ISEC which is not in the top ten also did well with an increase of 10%.

Allocation
While there were some changes in the counter, portfolio allocation has more or less stayed similar to what was planned. Current dividend yield of portfolio based on cost is about 4.7%.


Planned
Actual
Dividend
~ 60%
58.0%
REIT/ Business Trust
<= 30%
25.8%
Growth
~ 40%
40.1%
Punt
<=10%
9.4%
Cash
0%
1.9%

Earlier in the month, I have also wrote about asset allocation in which I have written that I am going for 30% cash and 70% stock allocation. A check on my spreadsheet shows that it is at this allocation. So no action will be taken to put in or take out cash from the portfolio.

Action
For the month of June, 
I have divested
  • A-REIT at $2.65 for a gain of 19%. Bought last December for a tantalising 7% yield for industry leader. With the recent gain, I have received more that 2 years of distribution and yield has dropped below 6%. 
  • Techwah at $0.515 for a gain of 10%. Reason for sale is to raise cash for other counters.
I have added
  • more Frasers Logistic and Industrial Trust at $1.03 after news of its latest acquisition. I take this as sign of how things will be like in the years to come.
  • Japan Food at $0.46 for its consistent dividend. If it can maintain its dividend, it will give me a return of 4.3%. Not fantastic, so hope it will be higher in future.
  • Duty Free International at $0.35 for its increase cash hoard and possible expansion in the next few years.
  • Valuetronics at $0.77 to round up my holdings. Also, I am satisfied with the 4.7% dividend yield it is giving me.
You can click on April and May for my actions taken in those two months.

Core holdings
Based on initial cost, the top 10 holdings take up 74.9% of the portfolio. With the purchase of Food Empire and Valuetronics, they have moved up in positions. The rest has remains pretty stable.
  1. Food Empire (9.7%) @ $0.43
  2. Raffles Medical (9.5%) @ $1.48
  3. Parkwaylife REIT (8.9%) @ $2.32
  4. Valuetronics (8.6%) @ $0.54
  5. Straco (8.1%) @ $0.84
  6. Best World (7.7%) @ $0.30
  7. Fraser Centrepoint Trust (6.4%) @ $2.01
  8. SingTel (6.1%) @ $3.82
  9. Micro-Mechanics (5.8%) @ $0.91
  10. Starhill Global (4.3%) @ $0.67
Looking Ahead
It has been a wonderful ride so far this year. Not sure how long the good time is going to last but enjoying it while it lasts. Looking forward to the release of next round of quarterly results from my holdings and am confident of good results from most of my holdings.

Similar to first half, I do not think there will be much action on my core holdings. However, I might tingle a bit more with my none-core. 

Up next, I will post on a short visibility report of my various holdings for the next few years.

Wednesday, 26 April 2017

Historical Performance against Benchmark

Decided to analyze my historical performance as compared to benchmark. So took time to gather data from SGX, SPDR and yahoo finance. I am grateful that SPDR actually responded to my request and provided me with yearly performance of SPDR STI extracted from Morning Star Direct. On yahoo finance, I can only get data until 2008. While not ideal, it's good enough for me to do some analysis.

Comparison of Yearly Return


*From 2003 to 2010, data from Morningstar Direct, obtained via SPDR Head of ETF Sales Strategy & Research. From 2011 onwards, data from SPDR STI ETF Semi-Annual Reports.

As seen from the table, out of the 14 years, my cash portfolio did better than benchmark only for 50% of the time; while CPF portfolio fared slightly better, outperforming by 64% of the time. However, if I scope it to the past 10 years, then things do look a lot better. Cash and CPF portfolios outperformed benchmark 70% and 80% of the time respectively.

Comparison of Compound Annual Growth Rate


* Obtained from 2016 SPDR STI ETF Semi-Annual Report.

Due to the good performances of the past few years, I have done better than benchmark in all the periods listed for both cash and CPF portfolios.

If I would to use the same amount of money to buy my cash portfolio, cpf portfolio and SPDR STI ETF on 31 Dec 2007......

* STI ETF prices obtained from Yahoo Finance. Assuming DRIP with STI ETF dividend, with issuing price tied to record date of dividend. Use 10 Jan 2008 STI ETF price for 2007 data point.

STI ETF would only return an average 0.4% annually. Cash and CPF portfolio would have a CAGR of 6.5% and 12.2% respectively. 2008 was the year of market crash due to sub-prime crisis and it definitely has an effect on the return.

Fast forward one year, if purchase was made at the end of 2008 (after the crash), STI ETF, cash and CPF portfolios would have an average annual return of 9.1%, 14.1% and 23.7%. 

Fast forward another year, if purchase was made at the end of 2009 (after the market recovered),  STI ETF, cash and CPF portfolios would have an average annual return of 2.7%, 11.9% and 15.7%.

The story behind the numbers

As seen from the various comparisons, performance in the initial years were mediocre for both cash and CPF portfolios. Both performed below the benchmark. Memory is failing but there were probably lots of short term buying and selling with s-chips a feature in the cash portfolio. 

In 2007, sat down and put on record a goal and strategies for both portfolios. Reading the past posts, cash portfolio was more inclined to growth investing, while CPF portfolio was inclined to dividend investing. 

Things seem to improve after that with CPF portfolio doing much better. So is dividend investing better than growth investing? Maybe but another factor that might have affected the performance is the amount of buy and sell. Due to CPF limit, I basically have only two holdings - First REIT and Metro after 2009. Since then, addition was due to Metro's bonus shares, First REIT's rights issue and DRIP. On the other hand, there is still quite an amount of buying and selling, hit and miss with my cash portfolio.

The next milestone came in 2014 and 2015 when I decided to review my goal and strategies. Not much change to CPF portfolio but I started to purchase STI ETF since 2014. As for cash portfolio, I am shifting from growth focus to a balance of growth and dividend. You can read more about it here. A refinement is made recently and can be found here.

I would think that I have also improved in analyzing a company as I have learned a lot more in the past two years from various investing platforms such as Motley Fool Singapore, Big Fat Purse (known as Dr Wealth now), The Fifth Person, The Edge and various financial blogs.

I have obtained an excellent return in 2016 (mainly due to Best World) and 20171Q, but a 2 years period is probably too short to conclude the effectiveness of the new strategies. However, it does give me confidence to continue on this investment journey.

Ending Note

Goal setting supported with strategies is essential if one wants to be successful in this journey. Going forward, I will continue to review my performance and refine my strategies. 

I believe that my CPF portfolio will continue to provide good return.  I hope that with a more active investing approach for my cash portfolio, its return will eventually catch up with that of my CPF portfolio.

Friday, 31 March 2017

2017 1Q Performance

I have decided that I will only update on my performance quarterly. Mimicking reporting on SGX. I believe this is a good move as this will subtly push me to spend more time in analyzing the business rather than the stock prices.


Performance
NAV of portfolio grew from $3.78 (30 Dec 2016) to $4.74, providing a return of 25.4% for the quarter. This beats my benchmark STI ETF which returned 10.3% based on its price appreciation from $2.94 to $3.19 and dividend of $0.053 over the same period. 

This quarter's performance is better than the preceding quarter which returned -4.0% and also better 2016 1Q which returned 3.6%.


The fantastic performance is largely attributed to Best World which has almost doubled this year. This was supported by good return from most stocks in my core holdings such as Valuetronics (34%), Food Empire (22%) , Micro-mechanics (17%), FCT (13%) and Plife (8%), Singtel (6%).


The two counters from core holdings that underperform are Raffles Medical (-0.2%) and Straco (-0.7%). This is expected as their 2016 results are flat. I am still holding on to them as their long term fundamentals are still in tact.

Beyond the core holdings, two other stocks did well for the quarter. They are 800 Super (30%) and AReit (14%).

Allocation
Allocation is not far away from planned. With this current allocation, dividend yield based on initial cost stands at 4.6%


Planned
Actual
Dividend
~ 60%
60.3%
REIT/ Business Trust
<= 30%
27.8%
Growth
~ 40%
33.9%
Punt
<=10%
5.4%
Cash
0%
5.8%

Action

There is not much activity for core holdings. The only transaction was the addition of Food Empire shares which move it into my core holdings. I believe in its turnaround and it should continue to do well for the next two years.

There are a lot more action for punting. These are my transactions for March.


  • Bought and sold Fu yu (up 10%) and City Neon (up 5%)
  • Bought SPH as I believe that the press giant will be able to find solutions on the drop of advertisement revenue.
  • Bought Keong Hong due to the detail analysis by various IN users. I think this stock has the potential of doing well.
  • Bought Oceanus. Pure punting. Like what I read about the company. New CEO is cutting cost and re-structuring debts. Prepare to lose all but if CEO is really able to turn the company's fortune, the upside is high too.
  • Sold Dutech as it does not generate sufficient interest for me (-0.2%)


Core holdings

Addition of Food Empire in March has moved it into the top 8. Listing the 9th stock as its cost is not that far off from the 8th stock.
  1. Raffles Medical @ $1.48
  2. Parkwaylife Reit @ $2.32
  3. Straco @ $0.84
  4. Best World @ $0.60
  5. Valuetronics @ $0.56
  6. Fraser Centrepoint Trust @ $2.01
  7. Food Empire @ $0.38
  8. SingTel @ $3.82
  9. Mirco-mechanics @ $0.91


Tuesday, 28 February 2017

February Portfolio

As mentioned in the previous post, I will report on my portfolio with a slightly different format. I hope this provides clarity on the performance of my portfolio and the information will be more useful.

Performance
The past two months, market has performed well and my benchmark STI ETF has returned about 7.3%. My portfolio also has a good run and it has returned 17.4%. Current dividend yield stands at 4.2%.


Allocation

Planned
Actual
Dividend
~ 60%
56.2%
REIT/ Business Trust
<= 30%
26.9%
Growth
~ 40%
30.8%
Punt
<=10%
5.0%
Cash
0%
13.0%


Action

I have provided update on my actions for January and February earlier. You can read them in these two earlier posts:

Core holdings
I have decided to report on my top 8 holdings based on initial cash outlay. I will also indicate the purchased price as it might affect the buying/selling decision psychologically even though theoretically, we should just value the company using the current price.


  1. Raffles Medical @ $1.48
  2. Parkwaylife Reit @ $2.32
  3. Straco @ $0.84
  4. Best World @ $0.60
  5. Valuetronics @ $0.56
  6. Fraser Centrepoint Trust @ $2.01
  7. SingTel @ $3.82
  8. Mirco-mechanics @ $0.91

Sunday, 26 February 2017

Update on Goal and Strategies

Two years ago, I had set new investment goal and strategies. You can read about it here. A review was made in December 2016 and you can read about it here.

I would say I have a greater clarity and will like to update my goal and strategies. It’s not far off from what I set in 2015 but there more details are provided.

Goal and Target
Main goal is to achieve financial independence by 55. Stretched goal is to achieve financial independence by 50.

To achieve the above, I am aiming for a compound annual growth rate (CAGR) of 8% for my cash portfolio. My stretched target is to achieve CAGR of 12%.

Strategies
1. Allocating approximately 60% of portfolio to invest in companies (including REIT and business trust) that provides consistent and sustainable dividend. REIT and business trust will not take up not more 30% of the portfolio.

2. Allocating approximately 40% of portfolio to invest in companies that has growth potential. These companies should have great management that has proven track record or they have clear catalysts that will fuel their growth. Approximately 10% of the portfolio can be invested in potential companies that I might not have done my due diligence yet.

Implementation
In the past 2 years, I searched for ideas to build up my portfolio. In theory, I should have done my due diligence before making my purchase. However, that does not quite work out for me, as I am afraid that I would take up too much time to look at the company in depth. By the time, I decided it’s time to buy, the valuation might become too steep.

So typically I would take a small stake (relative to the portfolio) before looking more in depth at the company. Of course, the problem with this approach is that some companies will not fit my requirement and will fall out of my portfolio. Hence, there was a large amount of churning in my portfolio for the past 2 years.

Moving forward, I foresee less churning and my core holdings should remain pretty stable.

Monitoring and Review
For the past 2 years, I have also attempted to report monthly my actions and companies that make up my portfolio. I have decided to relook at how my reporting will look so that it provides the reader and most importantly myself the progress of my portfolio.


Alright, that is about it on this Sunday morning. My next post will be a report on my portfolio at the end of February.